

Find partners
The PolicyViz Podcast

The PolicyViz Podcast

Hosted by The PolicyViz Podcast

Episodes

323

Latest episode

Nov 2026

Language

EN

About the show

Learn how to be a great data communicator and visualizer with host Jon Schwabish. Hear from experts in the fields of data science, data visualization, and presentation skills to improve how you and your organization collect, analyze, and communicate your data in better, more efficient, and more effective ways.

Listen to episodes

60 recent
November 18, 202638 min

Queens of Code: The Women Who Shaped Computing at NSA

I talk with Eileen Buckholtz, director of the Queens of Code Project, about the women who helped build and run NSA’s computing systems. Eileen shares stories from her own career and explains how she gathered her colleagues’ experiences while navigating pre-publication security review. We discuss the pay structures, promotion practices, training, and mentoring that helped women develop technical careers at the agency. We also explore early document interfaces, databases, and the challenge of keeping real-time systems running. Drawing on her book, Queens of Code, Eileen considers what today’s employers and STEM educators can learn from these women’s experiences. Subscribe to this podcast. Follow this show and everything dataviz on Instagram , LinkedIn , Substack , X , and YouTube . Check out the PolicyViz website to learn more about data and data visualization. Questions? Comments? Pitch ideas? Email me at: jon@policyviz.com Hosted by Zencastr where you can record, transcribe, edit, and automatically publish your meetings, podcasts, and more.


November 11, 202619 min

My Favorite Graphs: Lunge Feeding from the New York Times

In this episode of My Favorite Graphs, I revisit Jonathan Corum’s 2007 New York Times graphic about fin whales and lunge feeding. I explain how its whale illustrations, depth chart, tail movements, and speed chart work together to tell a story about a dive. Jonathan then takes us behind the scenes, tracing the graphic back to two scientific papers and the missing depth data he requested from a researcher. He shares how the layout came together and why giving the whale’s full dive enough space helped make the research accessible to a general audience. I wrap up with what this graphic can teach us about translating technical academic work into clear, compelling visual communication. Subscribe to this podcast. Follow this show and everything dataviz on Instagram , LinkedIn , Substack , X , and YouTube . Check out the PolicyViz website to learn more about data and data visualization. Questions? Comments? Pitch ideas? Email me at: jon@policyviz.com Hosted by Zencastr where you can record, transcribe, edit, and automatically publish your meetings, podcasts, and more.
November 4, 202645 min

Who Has Power? Data, Democracy, and Economic Justice with Taifa Smith Butler

I talk with Taifa Smith Butler, president of Dēmos, about how data and research can help communities build economic and political power. We explore how Dēmos works with grassroots partners to shape research questions, put economic indicators in context, and make policy information useful to the people affected by it. Taifa explains why measuring impact means looking beyond page views to the conversations, advocacy, and decisions that research supports. We also discuss the risks of losing access to federal data and what Dēmos learned when communities asked for something simpler than its interactive Power Scorecard. Throughout our conversation, we return to the work of connecting rigorous analysis with plain language, lived experience, and practical tools for change. Subscribe to this podcast. Follow this show and everything dataviz on Instagram , LinkedIn , Substack , X , and YouTube . Check out the PolicyViz website to learn more about data and data visualization. Questions? Comments? Pitch ideas? Email me at: jon@policyviz.com Hosted by Zencastr where you can record, transcribe, edit, and automatically publish your meetings, podcasts, and more.

October 28, 20266 min

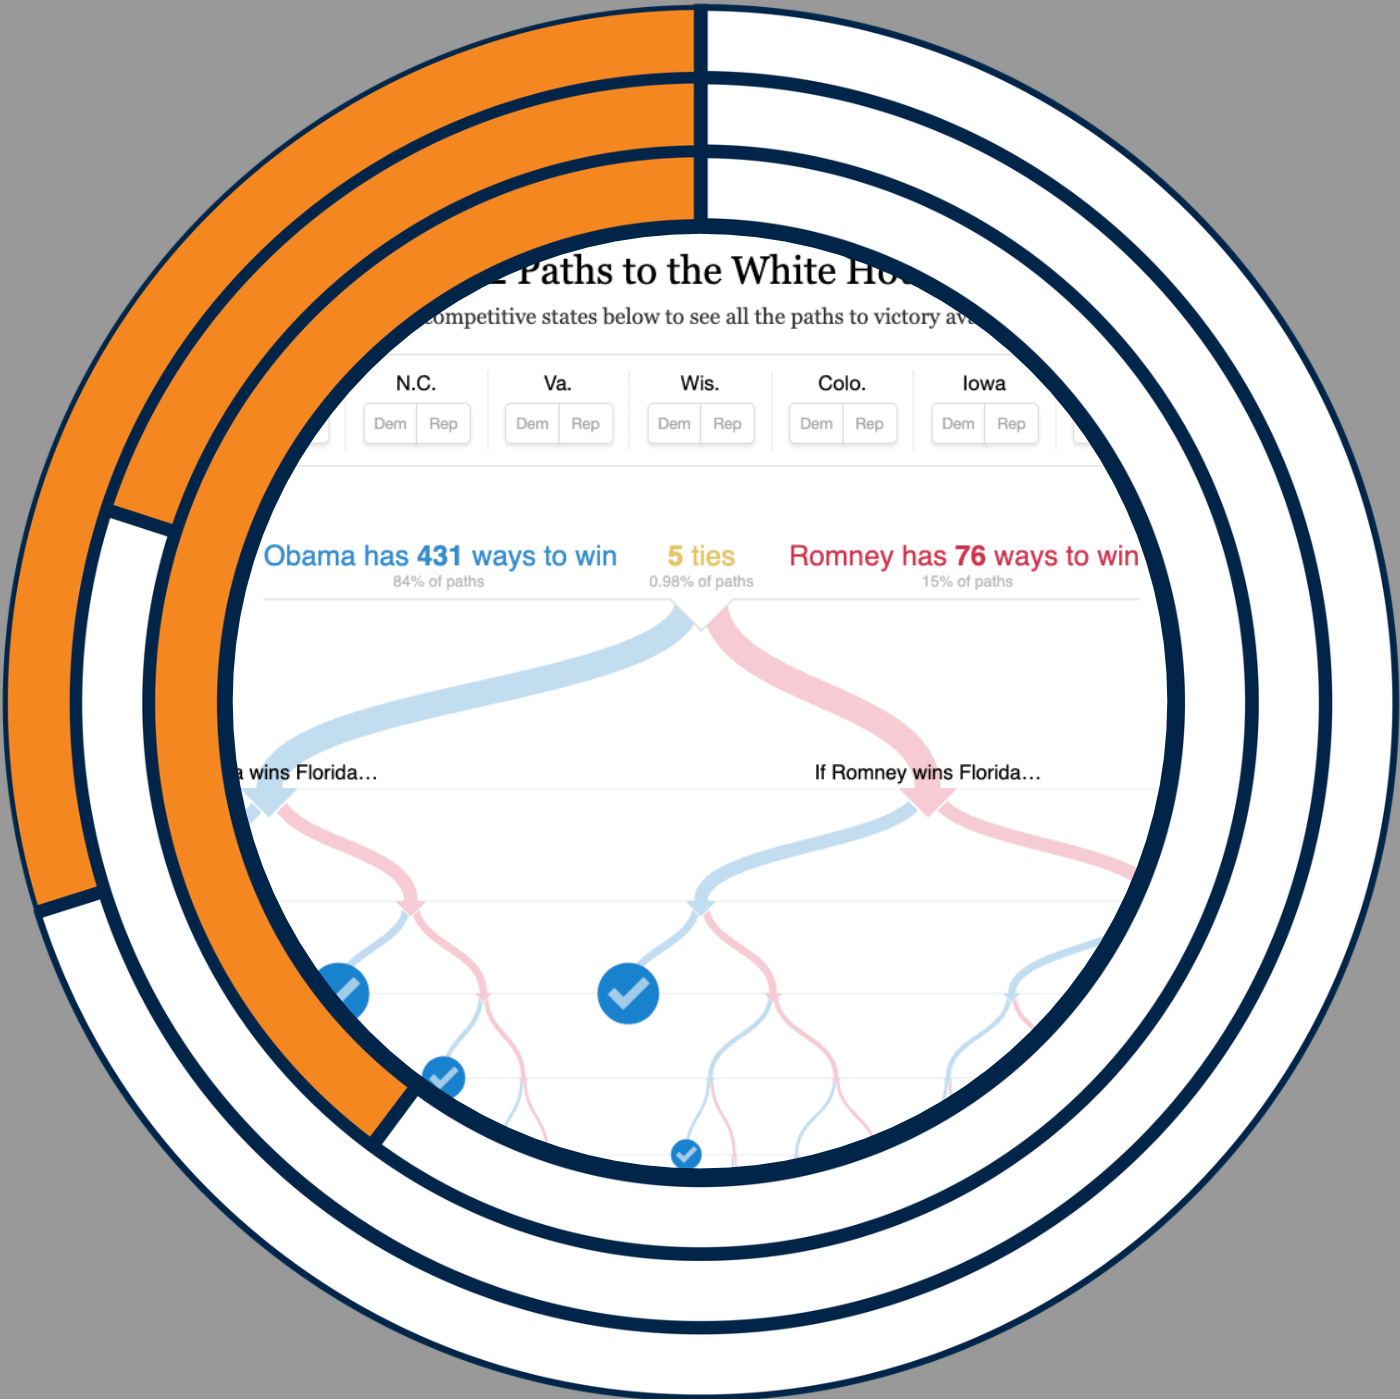
My Favorite Graphs: 512 Paths to the White House

In this My Favorite Graphs episode, I revisit the New York Times’ 2012 election visualization, 512 Paths to the White House, by Mike Bostock and Shan Carter. I walk through how its branching diagram shows the combinations of competitive states that could lead Barack Obama or Mitt Romney to victory. I explain how simple state-by-state toggles let readers test their own expectations and explore the remaining possibilities. I discuss the vertical layout, highlighting, and changing display as states are selected. What I love most is how the interaction lets each reader personalize the experience of exploring the data. Explore 512 Paths to the White House . Subscribe to this podcast. Follow this show and everything dataviz on Instagram , LinkedIn , Substack , X , and YouTube . Check out the PolicyViz website to learn more about data and data visualization. Questions? Comments? Pitch ideas? Email me at: jon@policyviz.com Hosted by Zencastr where you can record, transcribe, edit, and automatically publish your meetings, podcasts, and more.
October 21, 202642 min

Making Nonprofit Work Easier with David Watters

In this episode, I talk with David Watters about making everyday work easier for nonprofits. We explore how side spreadsheets, repetitive reporting, and reliance on a few go-to people can hide the true cost of getting things done. David explains how he identifies a useful first improvement by looking at how often a problem occurs, how much friction it creates, and what it prevents people from doing. We also discuss when straightforward automation is enough and where AI can help small teams with grant writing and qualitative data analysis. Throughout our conversation, we focus on giving people more time for the work they care about and building momentum through small, visible improvements. Subscribe to this podcast. Follow this show and everything dataviz on Instagram , LinkedIn , Substack , X , and YouTube . Check out the PolicyViz website to learn more about data and data visualization. Questions? Comments? Pitch ideas? Email me at: jon@policyviz.com Hosted by Zencastr where you can record, transcribe, edit, and automatically publish your meetings, podcasts, and more.

October 14, 202612 min

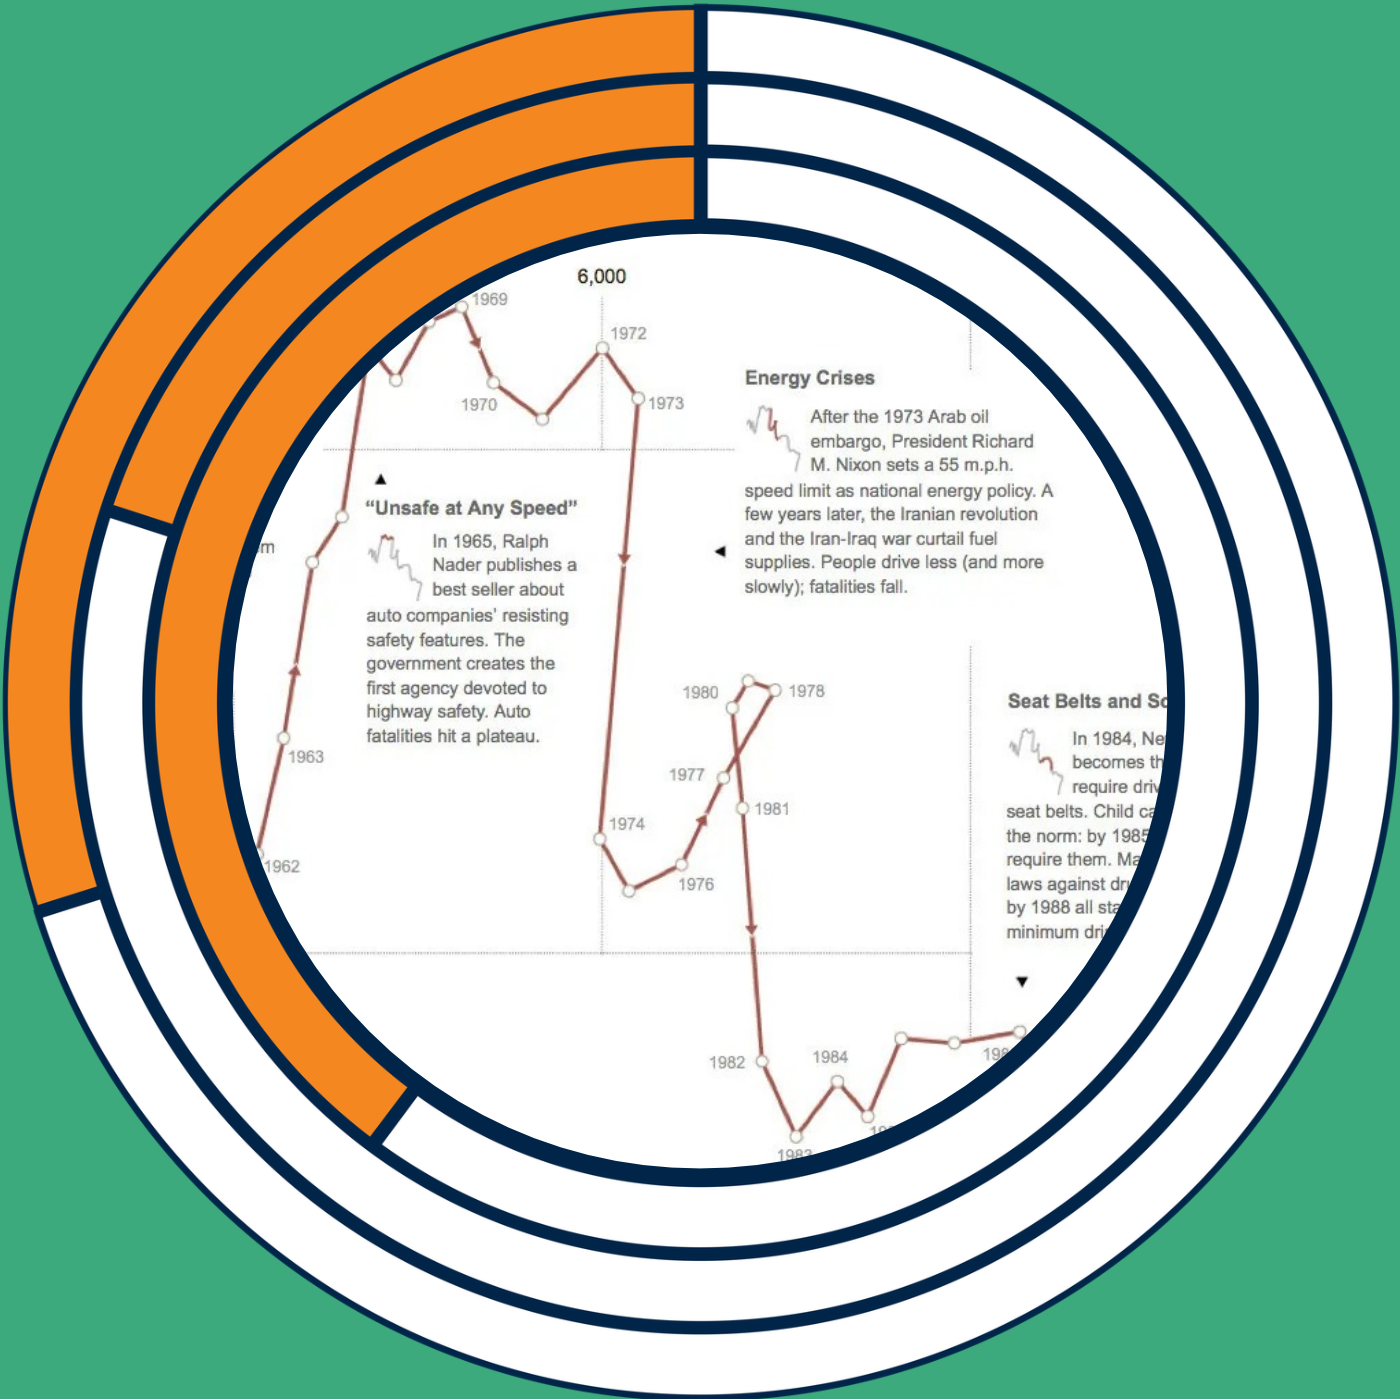
My Favorite Graphs: Driving Safety, In Fits and Starts

In this My Favorite Graphs episode, I revisit Hannah Fairfield’s 2012 New York Times graphic, Driving Safety, in Fits and Starts. I explain how its connected scatter plot pairs vehicle miles driven per capita with auto fatalities per 100,000 people, connecting each year to reveal changes over time. I walk through the chart’s shifts and loops, including the energy crises of the 1970s. I discuss why connected scatter plots can be difficult to read and what makes this example work so well. Most of all, I highlight how Fairfield combines the story, annotations, and miniature highlighted charts to explain both the data and how to read the graphic. Please note, I mistakenly said the live podcast at Cluster is on Thursday, but it's actually on Wednesday, November 11! I hope you can join me! Chart: Driving Safety, in Fits and Starts Subscribe to this podcast. Follow this show and everything dataviz on Instagram , LinkedIn , Substack , X , and YouTube . Check out the PolicyViz website to learn more about data and data visualization. Questions? Comments? Pitch ideas? Email me at: jon@policyviz.com Hosted by Zencastr where you can record, transcribe, edit, and automatically publish your meetings, podcasts, and more.
October 7, 202630 min

Mike "SullyDawg" Sullivan: Explaining Trillion-Dollar Budgets with Solo Cups

In this week’s episode of the show, I talk with Mike "SullyDawg" Sullivan, the viral creator behind the cup pyramid videos that turn massive federal budget numbers into something you can actually see. Mike spent decades as a teacher and coach before a bike ride inspired his first video stacking Solo cups to explain government spending — and it took off almost overnight. We dig into why three-dimensional scale succeeds where bar charts and line graphs fail, how he sources and cross-checks the data behind every video, and the four-part formula he swears by: topic, data, energy, and visual. Mike also opens up about the physical work of stacking thousands of cups in his garage, the unpredictable swings of the social media algorithms, and what’s next for his growing platform. It’s a fun, thoughtful conversation about making enormous numbers finally make sense. Subscribe to this podcast. Follow this show and everything dataviz on Instagram , LinkedIn , Substack , X , and YouTube . Check out the PolicyViz website to learn more about data and data visualization. Questions? Comments? Pitch ideas? Email me at: jon@policyviz.com Hosted by Zencastr where you can record, transcribe, edit, and automatically publish your meetings, podcasts, and more.

September 30, 202610 min

My Favorite Graphs: Stronger Together from The New York Times

In this My Favorite Graphs episode, I revisit a 2016 New York Times visualization comparing the convention speeches of Donald Trump and Hillary Clinton. I explain why highlighting phrases across miniature pages can reveal themes in qualitative data that word counts and bar charts can miss. I share how I have used a simple version of this technique in my own work and discuss tools for creating similar views. Alicia contributes a voice note about the project's development, including the highlighted Google Docs behind the finished graphics. I also discuss how pairing an overview with example quotes can help readers see the broader context of an interview, focus group, or speech. Subscribe to this podcast. Follow this show and everything dataviz on Instagram , LinkedIn , Substack , X , and YouTube . Check out the PolicyViz website to learn more about data and data visualization. Questions? Comments? Pitch ideas? Email me at: jon@policyviz.com Hosted by Zencastr where you can record, transcribe, edit, and automatically publish your meetings, podcasts, and more.
September 23, 202649 min

Playfair, Power, and the People Behind the Data: Lauren Klein on Data by Design

Lauren Klein joins me to talk about her new book, Data by Design , co-authored with a team of student collaborators. Over more than a decade of work, Lauren set out to place the history of data visualization in its full historical and political context, going well beyond the familiar “great men” narrative of Playfair and Snow. We talk about how she chose which historical visualizations to feature and redesign, the ethical questions that come up when working with data about the transatlantic slave trade and Indigenous mapping, and what it actually took to track down high-resolution scans of centuries-old charts. Lauren also shares what she wants readers, especially working data visualization designers, to take away: that visualization is only as powerful as how, and by whom, it's put to use. Subscribe to this podcast. Follow this show and everything dataviz on Instagram , LinkedIn , Substack , X , and YouTube . Check out the PolicyViz website to learn more about data and data visualization. Questions? Comments? Pitch ideas? Email me at: jon@policyviz.com Hosted by Zencastr where you can record, transcribe, edit, and automatically publish your meetings, podcasts, and more.

September 16, 202620 min

My Favorite Graphs: The Guardian's "Bussed Out"

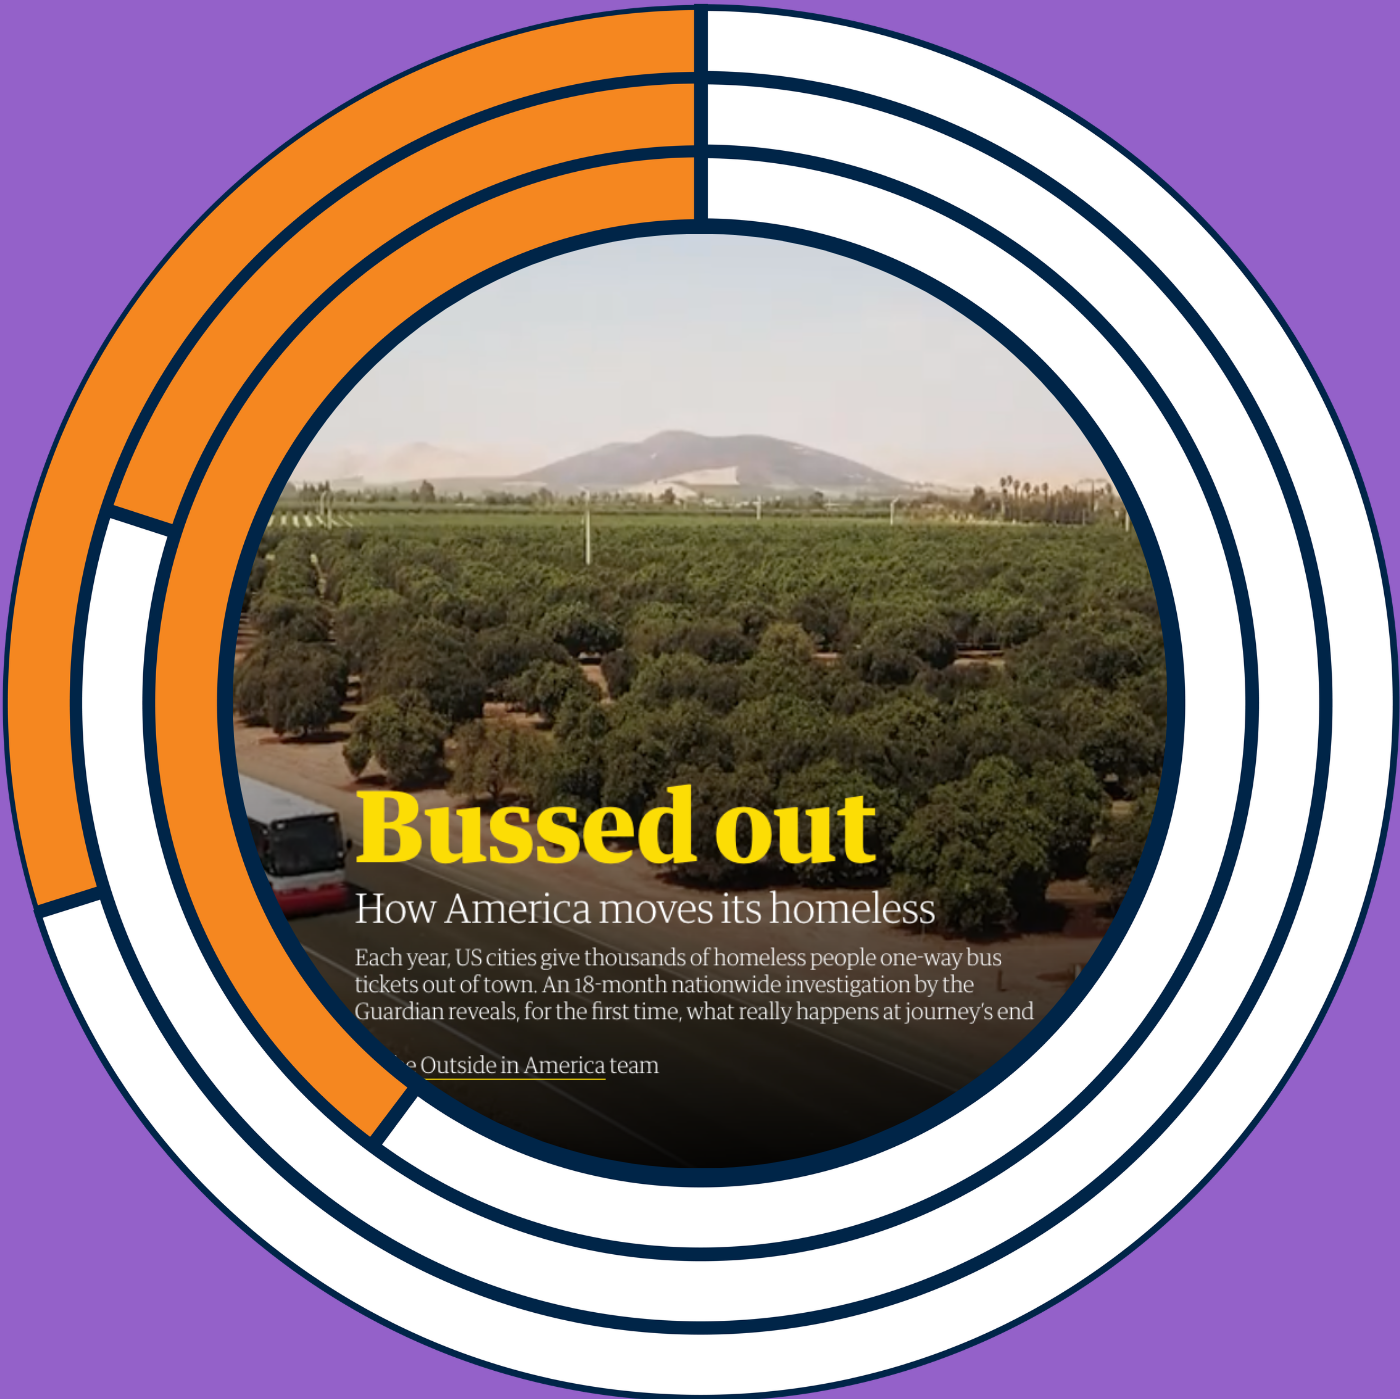
This week I kick off a new series on the show: My Favorite Graphs. I’m going to walk through the projects that shaped how I think about data visualization, data communication, and data storytelling. I'm starting with the Guardian's “Bussed Out: How America Moves Its Homeless,” published in December 2017, an 18-month investigation into the one-way bus tickets that US cities hand out to homeless people. There’s a special treat at the end too! My Favorite Graph: Bussed Out Subscribe to this podcast. Follow this show and everything dataviz on Instagram , LinkedIn , Substack , X , and YouTube . Check out the PolicyViz website to learn more about data and data visualization. Questions? Comments? Pitch ideas? Email me at: jon@policyviz.com Hosted by Zencastr where you can record, transcribe, edit, and automatically publish your meetings, podcasts, and more.

Is this your show?

Claim this listing to keep it up to date, reach guests who want to pitch you, and manage bookings with Guestify.

Claim this listing

More Technology podcasts